K-feldspar pIRIR150 dating of the Late Pleistocene sediments in the NW Khangai Mountains (Mongolia) using a standardized dose-response curve approach
 Yan Li
 Sumiko Tsukamoto
 Michael Klinge4
 - 1School of Ocean Sciences, China University of Geosciences, Beijing, China
- 2Leibniz Institute for Applied Geophysics, Hannover, Germany
- 3Institute of Geography, University of Göttingen, Göttingen, Germany
- 4Marine and Polar Research Center, China University of Geosciences, Beijing, China
K-feldspar luminescence dating has been widely applied to constrain the timing of Quaternary sedimentation in different environments. However, the measurements are time-consuming. Meanwhile, anomalous fading and partial bleaching are the two potential problems inducing dating uncertainty. In this study, sand-size K-feldspar grains extracted from 32 luminescence samples from the northern slope of the Khangai Mountains, Mongolia, were dated using the post-infrared (IR) infrared stimulated luminescence protocol (pIRIR150. subscript shows the second stimulation temperature). The standardized dose-response curves (sDRCs) for luminescence dating, which could improve the measurement efficiency, were constructed. The K-feldspar luminescence chronology has been established after careful investigations of fading correction and bleaching degree of the signals. The sDRCs and individual DRC yield consistent ages, indicating that sDRCs are applicable for luminescence dating with an improvement in measurement efficiency. The fading corrected ages using the two fading correction models are generally in agreement. Based on age comparisons between the radiocarbon dates, the fading corrected pIRIR150 and IR50 ages, the pIRIR150 signal was not fully bleached for several samples. In contrast, some IR50 ages were overestimated due to fading over-correction. The investigated profiles have documented the sedimentary information since the last deglaciation.
1 Introduction
Quartz and potassium-rich (K-) feldspar luminescence dating methods have been widely applied to establish precise chronologies of Middle-Late Quaternary sediments (Wallinga, 2002; Fuchs and Owen, 2008; Roberts, 2008; Thrasher et al., 2009; Lamothe, 2016). According to the single aliquot regenerative-dose (SAR) protocol (Wintle and Murray, 2000), the K-feldspar infrared stimulated luminescence (IRSL) dating protocol (Wallinga et al., 2000) could be used to date the sediments since the Middle Pleistocene due to the larger dating range compared to that of the standard quartz luminescence signal. For more effective equivalent dose (De) estimation, several approaches to constructing the standardized dose-response curve (sDRC) or standardized growth curve (SGC) have been proposed by Roberts and Duller (2004), which has been evaluated for luminescence dating of different types of sediments (Lai, 2006; Telfer et al., 2008; Long et al., 2010). More recently, the sDRCs for quartz OSL and K-feldspar IRSL signals based on the re-normalization and least-squares normalization methods have been constructed in a global field of vision (Li et al., 2015a, 2015b; Li B. et al., 2018). Accordingly, the characteristics of the sDRCs for the OSL signal from quartz fraction and the IRSL signal from various coarse- and fine-grained fractions were explored (Zhang and Li, 2019; Fu et al., 2020).
The accuracy of the K-feldspar IRSL luminescence ages could be potentially influenced by two major issues. First, anomalous fading, as the undesirable loss of the IRSL signal, could result in age underestimation. Athermally more stable signals, such as the post-IR IRSL (pIRIR) (Thomsen et al., 2008; Buylaert et al., 2009; Li and Li, 2011), pulsed IRSL (Tsukamoto et al., 2017), IR photoluminescence (IR-PL) (Prasad et al., 2017), and post-isothermal IRSL (Lamothe et al., 2020), have shown less-to-negligible fading. The outcome of the previous studies has shown that the pIRIR290 and MET-pIRIR250 (subscript means the stimulation temperature) signals do not fade (Li and Li, 2011; Thiel et al., 2011), which have been widely applied for constraining the timing of sedimentation of various Quaternary archives (Buylaert et al., 2013; Yi et al., 2015; Guo et al., 2016). However, a higher stimulation temperature of the pIRIR signal induces a larger residual dose than that of the signal stimulated at a lower temperature, resulting from the slower bleaching process (Colarossi et al., 2015; Tsukamoto et al., 2017). This is the second problem that influences the accuracy of the luminescence ages, especially for the young sediments, as the level of the residual dose is significant compared to the equivalent dose. Therefore, applying the low-temperature stimulated IRSL signal (fast-to-bleach), such as the pIRIR150 (Madsen et al., 2011; Reimann et al., 2011; Long et al., 2014), pIRIR225 (Buylaert et al., 2009), and MET-pIRIR170 (Fu and Li, 2013) signals, with proper fading correction is reasonable to date the young sediments. Although anomalous fading is not negligible, it can be corrected using the proper models (Huntley and Lamothe, 2001; Lamothe et al., 2003; Wallinga et al., 2007; Kars et al., 2008). Among them, the models proposed by Huntley and Lamothe (2001) are applicable to correct anomalous fading for ages not older than ca. 20–50 ka, corresponding to the linear region of the dose growth. The “dose-rate correction” model suggested by Lamothe et al. (2003) could yield reliable corrected ages correlating to both the linear and nonlinear parts of DRC (Lamothe et al., 2003; Li et al., 2018a). Compared to the model of Huntley and Lamothe (2001), the fading correction following Lamothe et al. (2003) is advantageous because it could be applied for the full DRC. It is also beneficial to use the Lamothe et al. (2003) model as no iteration is needed. This model has been used to correct ages associated with the nonlinear dose region in several studies (Mercier et al., 2019; Nalin et al., 2020), but it has rarely been applied to relatively young ages.
Khangai Mountain is located in central Mongolia. Sediments in the Khangai-Gobi-Altai (western Mongolia) since the last glaciation have been widely studied (Peck et al., 2002; Feng et al., 2005, 2007; Schwanghart et al., 2009; Klinge et al., 2017; Lehmkuhl et al., 2018). The north slope of the Khangai Mountain, covered by forest steppe, is regarded within the center of the Siberian-Mongolian High (Böhner, 2006). Investigating the Quaternary archives in this area helps better understand the evolution of the East Asian winter monsoon in the Late Quaternary. A robust chronology is fundamental for explorations of geomorphological processes, glaciation, and palaeoclimatological evolution. Timing of sedimentation in west Mongolia since the Late Pleistocene has been mainly constrained using radiocarbon, quartz, and K-feldspar luminescence dating approaches (see references in Klinge and Sauer, 2019). The geomorphological evolution along the north slope of Khangai Mountain, Mongolia, since the Late Pleistocene has been well studied by Klinge et al. (2022). However, the applicability of the sDRCs and the reliability of the K-feldspar luminescence ages were poorly investigated. In this study, the coarse-grained K-feldspar fraction from 32 luminescence samples of soil, aeolian, alluvial, and colluvial origins was dated using the pIRIR150 protocol. Preliminary pIRIR150 ages based on the individual DRC have been presented by Klinge et al. (2022). sDRC was constructed based on the re-normalization method suggested by Li et al. (2015a). The fading correction for the pIRIR150 and IR50 luminescence ages was conducted using the fading correction models proposed by Huntley and Lamothe (2001) and Lamothe et al. (2003). The aim of this study is threefold. First, we aim to construct the sDRCs for the K-feldspar IRSL signals using the re-normalization method of Li et al. (2015a) and the test dose-standardization method of Roberts and Duller (2004). The reliability of the sDRCs was assessed by comparing the ages determined using sDRC and the individual DRCs. Second, the apparent ages are corrected for anomalous fading to evaluate the applicability of the fading corrected models. Finally, the radiocarbon dates, the fading corrected IR50, and pIRIR150 ages are compared to investigate the degree of signal bleaching and determine the timing of sedimentation in the NW Khangai Mountain area since the Late Pleistocene.
2 Sample preparation
In this study, 32 luminescence samples were collected from 14 selected sites in the area of Telmen Nuur (lake) and Tosontsengel to investigate the reliability of the sDRC and luminescence ages and establish the chronological framework of the sediments of different types (Figure 1, Table 1). The sediments are characterized as aeolian, soil, alluvial, and colluvial types. Detailed information on the study area can be found in Klinge et al. (2022) and Supplementary Table S1.
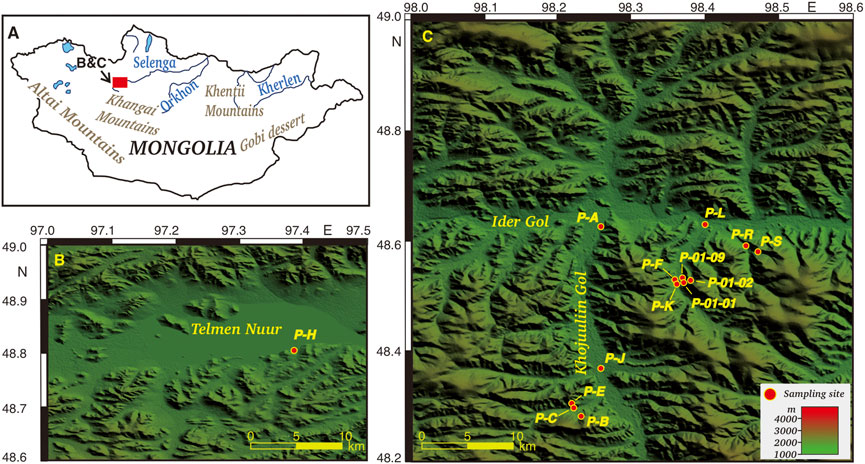
FIGURE 1. Study area and sampling sites. The red block in (A) shows the study area, including Telmen Nuur (B) and Tosontsengel (C). The Source of the digital elevation model is http://www.cgiar-csi.org.
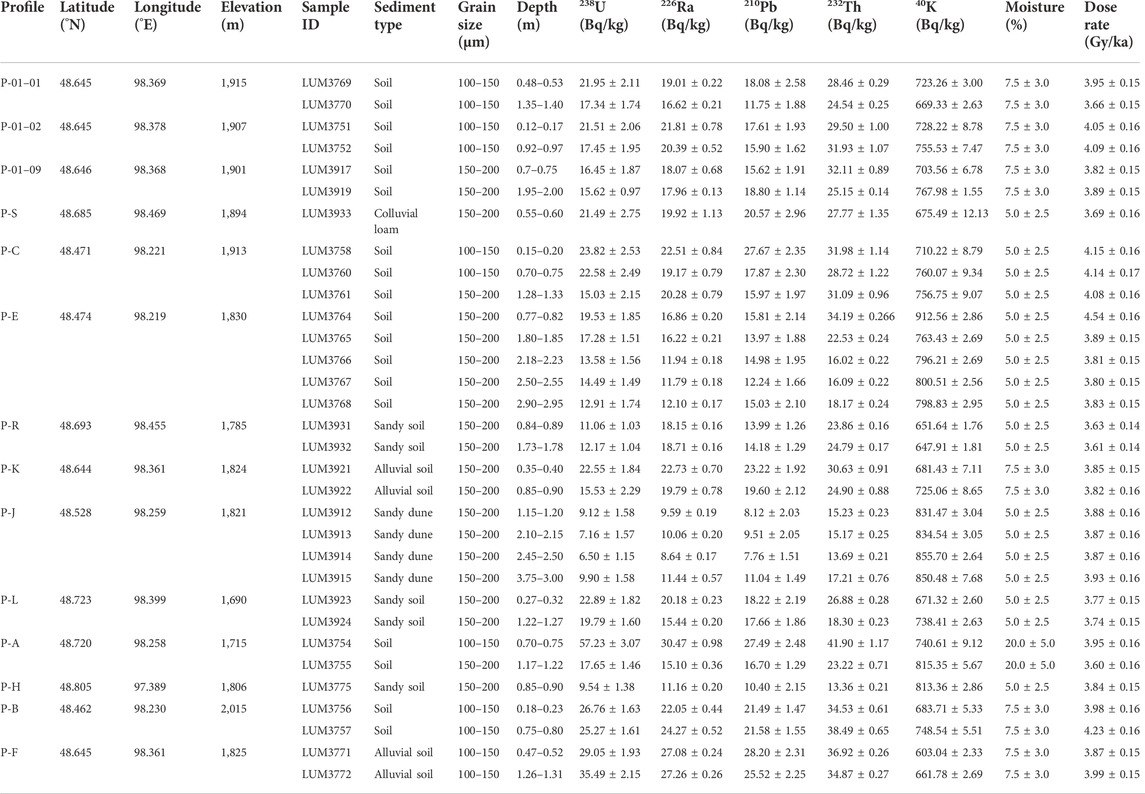
TABLE 1. Sample information and dose rate determination.
The luminescence samples were taken using cylinders from the freshly prepared profiles. The cylinders were fully filled with the sediments and sealed to avoid material mixture and light exposure. Sample preparation was carried out under subdued red light in the luminescence laboratory of the Leibniz Institute for Applied Geophysics in Hannover, Germany. The outer 2 cm of sediments were discarded for luminescence dating due to potential light exposure. The inner part was dry-sieved, and the dominant fraction at the grain-size interval of either 100–150 or 150–200 μm was collected (Table 1). The selected fraction was then treated with diluted hydrochloric acid (HCl) for 2 hours, sodium oxalate (Na2C2O4) for 1 day, and hydrogen peroxide (H2O2) for 2 hours to remove carbonate, mineral aggregates, and organic matter, respectively. Heavy liquid separation was conducted after chemical treatment to extract the quartz and K-feldspar grains, corresponding to the heavy liquid density of 2.62–2.70 and <2.58 g/cm3, respectively. Etching was specially conducted on the quartz grains using 40% hydrofluoric acid (HF) for 1 hour to remove the remaining feldspar grains and etch quartz grains to eliminate the effect of the alpha-irradiated outer layer.
3 Luminescence instrumentation, protocol, and measurements
Luminescence measurements were conducted on automated Risø TL/OSL readers (DA-15/20), equipped with 90Y/90Sr beta sources. The mean dose rate of the beta sources (
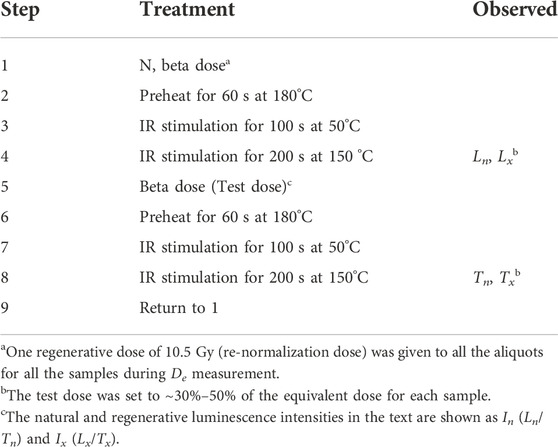
TABLE 2. The protocol of K-feldspar pIRIR150 dating.
For each sample, 24 aliquots were measured using the pIRIR150 protocol. The initial 5 s of the signal was subtracted by the last 15 s to calculate the luminescence intensity (I). The DRCs for individual samples were constructed using the regenerative doses and the corresponding luminescence intensities (Ix). The aliquots which yielded unsatisfactory recycling ratios (either <0.9 or >1.1) were excluded for further De determination and DRC construction. Specifically, a regenerative dose of 10.5 Gy was given to all the aliquots as a re-normalization dose for sDRC construction (Table 2).
To evaluate the behavior of dose recovery and the level of the residual signal, the dose recovery test and residual dose measurement were conducted for each sample. Six aliquots of each sample were first bleached in a Hönle SOL2 solar simulator for 4 h. Three of them were measured to determine the residual dose after the 4 h bleaching. The other three bleached aliquots were firstly given a dose close to the De value and then measured using the pIRIR150 protocol. The obtained De was subtracted by the residual dose and then divided by the given dose to calculate the dose recovery ratio. Fading experiments were carried out for all samples to assess anomalous fading for the IR50 and pIRIR150 signals. The Ix values of three or four aliquots for each sample were repeatedly measured after being given a fixed dose close to the De value and stored for various delay times (td). The fading rates (g, %/decade) were determined by fitting the Ix - td with the logarithm function. The g values were used for fading correction using the models of Huntley and Lamothe (2001) and Lamothe et al. (2003) (see Section 6).
Additional 25 samples of charred material, soil organic matter, wood, bone, and plant from nine profiles were collected and dated using the Accelerator Mass Spectrometry (AMS) 14C dating method. The measurements were carried out at Beta Analytic Inc. and Oxford Radiocarbon Accelerator Unit. The dating results are used to evaluate the degree of bleaching of luminescence signals in Section 7. The detailed information on radiocarbon dates was listed in Klinge et al. (2022), which has also been included in Supplementary Table S2.
4 Dosimetry
50 or 700 g of the dried material was measured in sealed Marinelli beakers to determine the activities of the radioactive elements for each sample using high-resolution gamma spectrometry (Table 1). The materials were stored for at least 4 weeks before measurement to secure equilibrium between radon and its daughter nuclides. The calculation of the external beta and gamma dose rate was conducted using the conversion factor in Guérin (2011) and beta attenuation factors in Mejdahl (1979). The a-value was set to 0.09 ± 0.02 following Balescu et al. (2007). The cosmic dose rate was calculated for each sample as a function of depth, altitude, and geomagnetic latitude, following Prescott and Hutton (1994). The water content of different types of samples is listed in Table 1 based on field observation and those in the literature (Schwanghart et al., 2009; Lehmkuhl et al., 2011). The uncertainty was used to account for possible moisture alterations in the geological period. For each feldspar sample, an additional internal dose rate was calculated based on a K concentration of 12.5 ± 0.5% (Huntley and Baril, 1997) and a87Rb concentration of 400 ± 100 ppm (Huntley and Hancock, 2001). Table 1 summarizes the environmental dose rates for all the K-feldspar samples, ranging from 3.60 ± 0.16 to 4.54 ± 0.16 Gy/ka.
5 Determination of De and apparent age
5.1 Individual DRC
Figure 2 shows the decay curve, DRC, and De distribution for the IR50 and pIRIR150 signals of one representative sample, LUM3923. The DRC was fitted using both the single saturating exponential and linear functions. The natural luminescence intensity (In) was projected onto the corresponding DRC to determine De for each sample. The equivalent dose and uncertainty were presented as the mean De value and standard error of all the Des with the acceptable recycling ratios (0.9–1.1). The IR50 De values are between 0.57 ± 0.03 and 41.39 ± 0.57 Gy determined by the single saturating exponential function fitted DRCs, whereas those for the pIRIR150 signal range from 0.97 ± 0.10 to 48.75 ± 0.78 Gy. Based on the linear fitted DRCs, the IR50 De values range from 0.59 ± 0.04 to 41.32 ± 0.57 Gy, whereas the pIRIR150 Des range from 1.04 ± 0.12 to 48.69 ± 0.77 Gy. The overdispersion value for most of the samples is within 10%. The apparent ages were calculated by dividing De by the environmental dose rate (Table 3). Figure 3 demonstrates the results of dose recovery tests and residual dose measurements. Although the dose recovery ratios are slightly smaller than 0.90 (0.88–0.90) only for a few samples, the dose recovery ratios for the IR50 and pIRIR150 signals for most of the samples are within 0.9–1.1. It suggests that the natural doses could be recovered by the pIRIR150 measurements within 10% uncertainty. The residual doses are between ca. 0.14 and 0.81 Gy for pIRIR150, and those are between ca. 0.03 and 0.48 Gy for IR50.
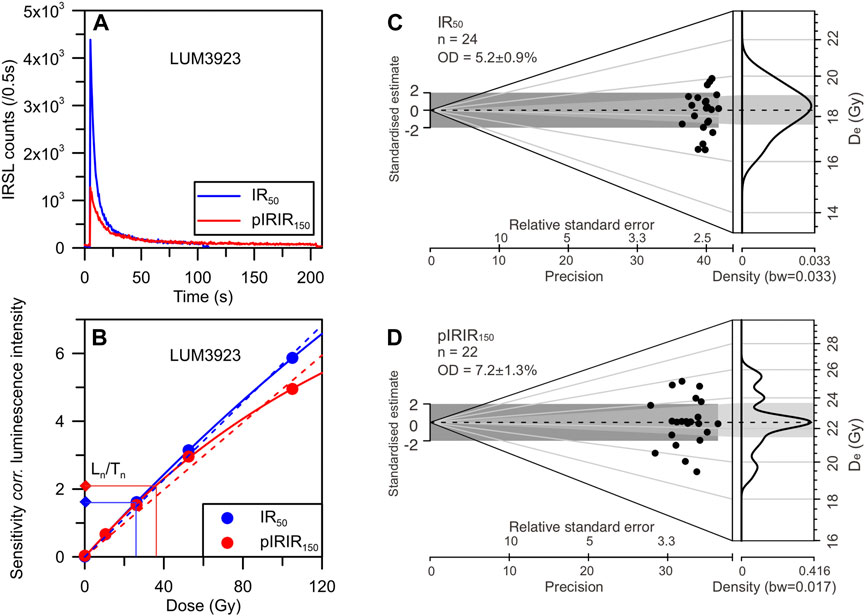
FIGURE 2. Decay curves (A), dose-response curves (B), and De distribution for the IR50 (C) and pIRIR150 (D) signals for one representative sample LUM3923. The dose-response curve was fitted using a linear (dashed line) and one saturating exponential (dashed line) equation in Figure 2B, respectively.

TABLE 3. Results of pIRIR150 dating for all the samples.
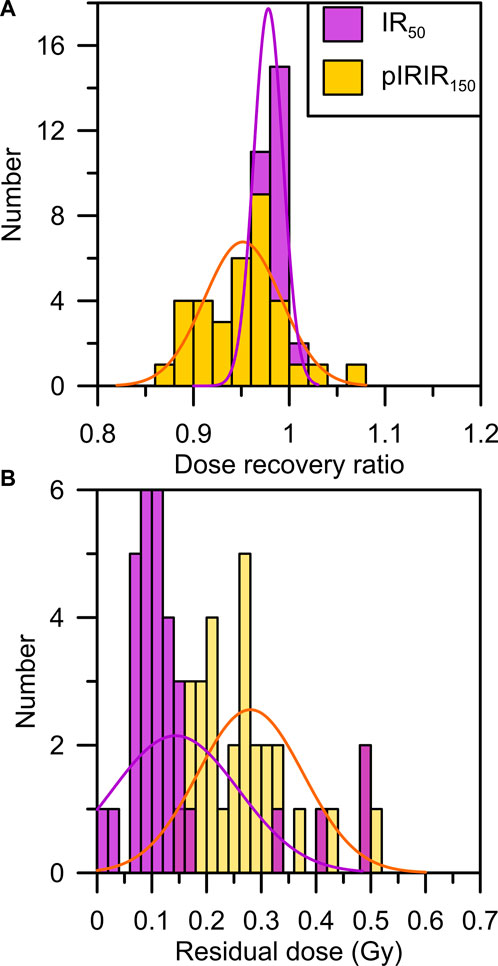
FIGURE 3. Histograms of dose recovery ratios (A) and residual dose (B) for the IR50 and pIRIR150 signals for all the samples. The dose recovery ratio and residual dose were determined using three aliquots for each sample.
5.2 sDRC construction and De determination
5.2.1 sDRC construction of intensity re-normalization
sDRCs were constructed following the re-normalization procedure of the sDRC construction (SGC in Li et al., 2015a). The regenerative dose of 10.5 Gy was set as a re-normalization dose. All the In and Ix values for each aliquot were first divided by their corresponding I10.5 value to eliminate the scatter between aliquots. The re-normalized Ix was then plotted against the corresponding regenerative dose. The sDRCs were fitted using different data and functions (pIRIR150: Figures 4A single saturating exponential and Figure 4B-linear; IR50: Figures 4C single saturating exponential and Figure 4D-linear). The fitting equation and the corresponding R-squared value are shown in each diagram. The sDRC for each sample was also constructed and presented using the dashed lines (Figures 4A–D). The sDRC De was determined by projecting In onto the sDRC using the R package “numOSL” (Peng et al., 2013). Although the IR50 sDRCs for the individual samples are identical to the sDRC using all the re-normalized IR50 Ixs, the individual pIRIR150 sDRCs show two clusters (Figures 4A,B). The upper part shows linear dose growth for each sample, including the individual sDRCs for the samples collected from profiles P-01-02, P-E, P-R, P-K, P-A, P-H, and P-F, whereas those in the lower part are related to the nonlinear dose growth. As the sDRCs of the two clusters are indistinguishable from each other in aspects of location, age range, and environmental dose rate, further investigations are required to understand the shape discrepancy of the individual sDRCs. De and apparent ages determined by the sDRCs are shown in Table 3 (Li et al., 2015a).
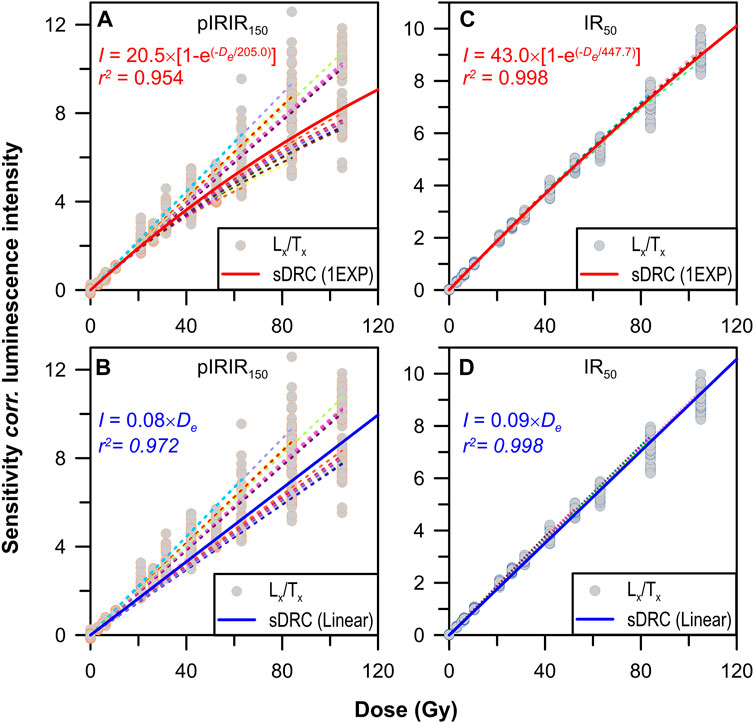
FIGURE 4. Construction and comparison sDRC using data from all the samples following Li B et al. (2015a). (A,B) The pIRIR150 sDRCs using data of all the samples fitted by the one saturating exponential (1EXP) and linear functions, respectively (solid line). (C,D) The IR50 sDRCs using data of all the samples fitted by the 1EXP and linear functions, respectively (solid line). The dashed lines show the sDRCs for the individual samples using 12 aliquots.
5.2.2 sDRC construction of intensity multiplied by test dose
According to Roberts and Duller (2004), the value of Ix in the SAR protocol was first multiplied by the corresponding test dose (TD) in Gy and then plotted against the regenerative dose. Similar to that in 5.2.1, sDRCs for pIRIR150 and IR50 were constructed using the single saturating exponential and linear functions, respectively (Figure 5). The fitting equation and the R-squared value are also shown. In was then multiplied by the TD value and projected onto the sDRC to determine the De value for each sample (Table 3) (Roberts and Duller, 2004).
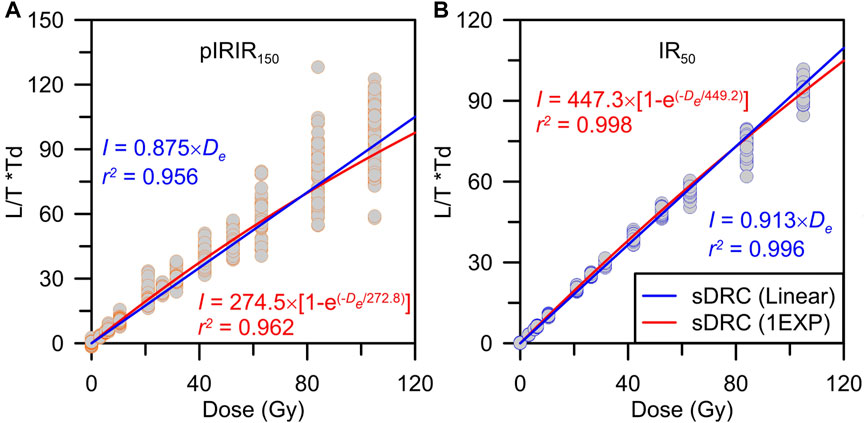
FIGURE 5. sDRC construction using data from all the samples following Roberts and Duller (2004). The sDRCs fitted using 1EXP and linear functions using the pIRIR150 (A) and IR50 (B) data, respectively.
5.3 DRC and De comparison
It demonstrates that the constructed IR50 and pIRIR150 sDRCs in this study are comparable within ca. 40 Gy, which corresponds to the linear growth region of dose growth, while those show slight discrepancy when De is larger than ca. 40 Gy. Similarly, the sDRCs constructed using the linear and single saturating exponential functions following Roberts and Duller (2004) are broadly in agreement (Figures 5A,B). Moreover, the characteristic saturation doses (D0) of the sDRCs after single saturating exponential fitting are comparable by construction using the two approaches of Li et al. (2015a) and Roberts and Duller (2004), indicating that the sDRC in identical shape could be constructed using the two methods, although the normalized luminescence intensities are in a different scale.
Des determined by the sDRC and individual DRC are compared in Figure 6. For both the pIRIR150 and IR50 signals, the individual-DRC-determined Des are generally consistent with the sDRC-determined Des in the two approaches (Figures 6A,B,D,E). For the pIRIR150 signal, although the sDRC determined Des of approximately 50 Gy are slightly larger than those yielded by the individual DRCs, they are still comparable within 10% uncertainty (Figures 6A,B). Meanwhile, the sDRCs fitted using single saturating exponential and linear functions result in Des in agreement (Figures 6C,F). They imply that both the single saturating exponentially and linearly fitted sDRCs could yield reliable De for the studied Mongolian samples within ca. 20 ka, which is applicable for De measurement with high efficiency. The De values determined using the sDRCs fitted by the single saturating exponential function for the two signals following Li et al. (2015a) were used for fading correction below.
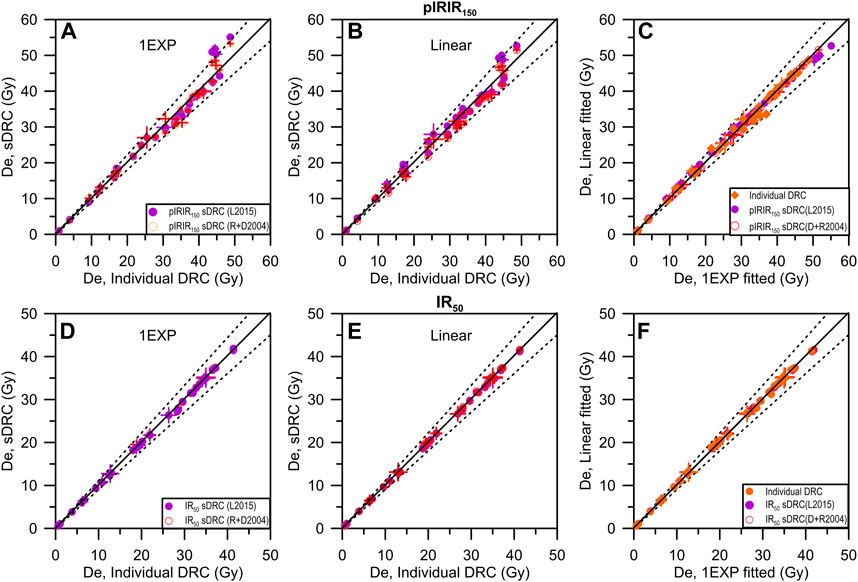
FIGURE 6. Comparisons of De determined by the sDRCs and the individual DRC for each sample (A) and (B), pIRIR150; (D) and (E), IR50). The De value is presented as the mean De of 24 aliquots for each sample. (A,D) The results determined using the 1EXP fitted DRCs, and those determined using the linear DRCs are shown in (B,E). (C,F) The relationship between Des determined by the 1EXP and linear fitted DRCs.
6 Fading correction of the K-feldspar luminescence ages
In order to eliminate the underestimation of the K-feldspar luminescence ages by anomalous fading, the numerical models proposed by Huntley and Lamothe (2001) and Lamothe et al. (2003) were applied and compared in this study. The sDRC fitted using the single saturating exponential function and the yielded apparent ages were used for fading correction. The fading rates of ca. 4.76–8.42%/decade for IR50 and ca. 0.73–3.86%/decade for pIRIR150 were determined (Figures 7A,B). Table 3 summarizes the outcomes of the fading rates and the fading corrected ages. The fading corrected pIRIR150 ages following Huntley and Lamothe (2001) are between 0.29 ± 0.05 and 17.0 ± 1.5 ka, and the IR50 ages after fading correction range from 0.25 ± 0.04 to 40.8 ± 23.5 ka (Table 3). Following the fading correction model of Lamothe et al. (2003), the initial luminescence intensity I0 was first corrected for fading and then projected onto the sDRC to yield the fading corrected De (Figure 7C). The fading corrected pIRIR150 ages determined by the fading corrected De and the environmental dose rate are 0.32 ± 0.05–18.1 ± 2.7 ka. For the IR50 signal, the fading corrected ages range from 0.31 ± 0.06 to 38.8 ± 16.8 ka.
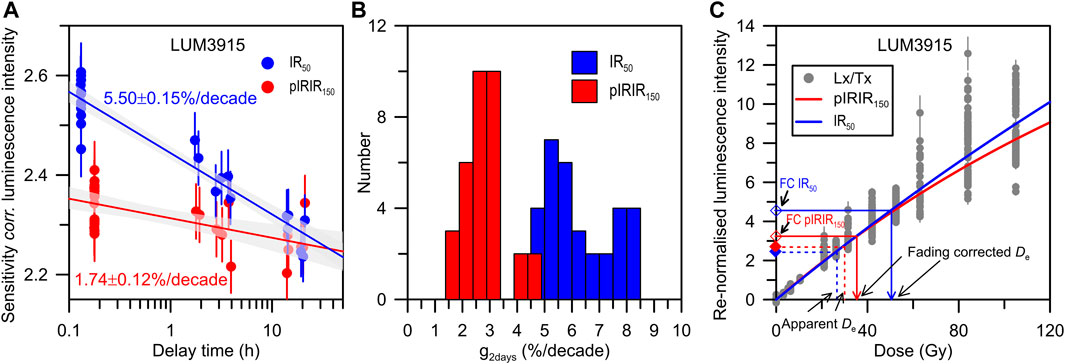
FIGURE 7. Results of fading correction. (A) The determination of the fading rates (g, %/decade) of IR50 and pIRIR150 signals for one representative sample, LUM3915. (B) The distributions of the g values of IR50 and pIRIR150 signals for all the samples. (C) The fading correction approach for the representative sample LUM3915 following Lamothe et al. (2003).
Figure 8A shows that the fading corrected ages following Huntley and Lamothe (2001) are generally consistent with those after correction following Lamothe et al. (2003). Specifically, the pIRIR150 ages corrected by the two models are perfectly consistent with each other. The fading corrected IR50 ages agree with each other within 10% uncertainty. Meanwhile, a tendency of slight underestimation with the increase in age has been observed for those after Huntley and Lamothe (2001) to the corresponding ages after Lamothe et al. (2003). One possible explanation is to associate the fading corrected IR50 ages of > ca. 30 ka with the nonlinear region of dose growth, for which the fading corrected ages after Huntley and Lamothe (2001) start to be underestimated.
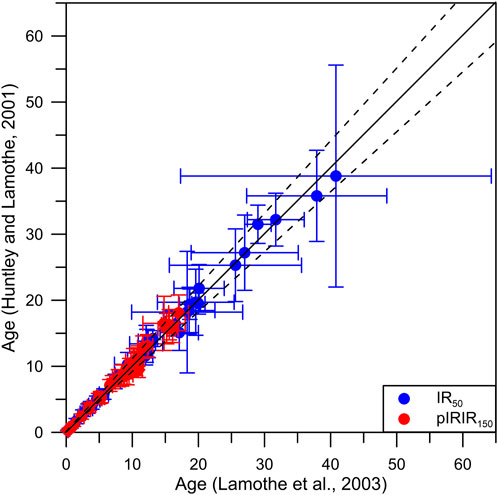
FIGURE 8. Comparisons of the fading corrected ages following Huntley and Lamothe (2001) and Lamothe et al. (2003).
7 Degree of signal bleaching and luminescence chronology
As the IR50 signal is bleached much faster than the pIRIR150 signal (e.g., Reimann et al., 2012; Tsukamoto et al., 2017), the pIRIR150 signal would be well bleached if the pIRIR150 are consistent with the IR50 ages (Murray et al., 2012; Reimann et al., 2015; Li et al., 2018b). In order to assess the degree of bleaching for the luminescence signals, radiocarbon dates, the fading corrected IR50, and pIRIR150 ages are compared. The fading corrected ages using the approach of Lamothe et al. (2003) were employed. Radiocarbon dates are used as a reference to evaluate the reliability of luminescence ages.
The fading corrected IR50 and pIRIR150 ages of each profile are shown in Figure 9. Some of the IR50 ages agree with the corresponding pIRIR150 ages, whereas the IR50 ages tend to overestimate the associated pIRIR150 ages for a large portion of samples. In order to explore the tendency and potential reason for age discrepancy, the IR50/pIRIR150 age ratios were calculated and plotted against the pIRIR150 ages (Figure 10A). The age ratio varies from ca. 0.5 to 3.0. Although the pIRIR150 ages overestimate the corresponding IR50 ages for the samples younger than ca. 6 ka (e.g., those in profile P-A), the IR50 ages tend to overestimate the pIRIR150 ages for the relatively old samples (Figure 10A). The pIRIR150 age is larger than the IR50 age for the younger samples due to partial bleaching of the pIRIR150 signal, which is relatively severe for the young sample. However, this could not explain the overestimated IR50 ages for the older samples. The overestimation of the IR50 ages may be related to the age over-correction by the large fading rate. The relationship between the IR50/pIRIR150 age ratio and the associated IR50 fading rates is demonstrated in Figure 10B. It shows that the IR50 age is overestimated with the increased g value. Fading rates larger than ca. 6%/decade have yielded unacceptable corrected ages (Thomsen et al., 2008; Tsukamoto and Duller, 2008; Li et al., 2017). The comparison between the reference chronology of Chinese loess and the corresponding fading corrected ages using the two models (Lamothe et al., 2003; Kars et al., 2008) also suggested that fading over-correction happened with g values larger than ca. 4–5%/decade using the Lamothe et al. (2003) model (Li et al., 2018a). In this study, some of the fading rates of up to ca. 8.42%/decade were determined for the IR50 signal (Figure 7B), suggesting that the fading rates are overestimated, therefore yielding the over-corrected IR50 ages.
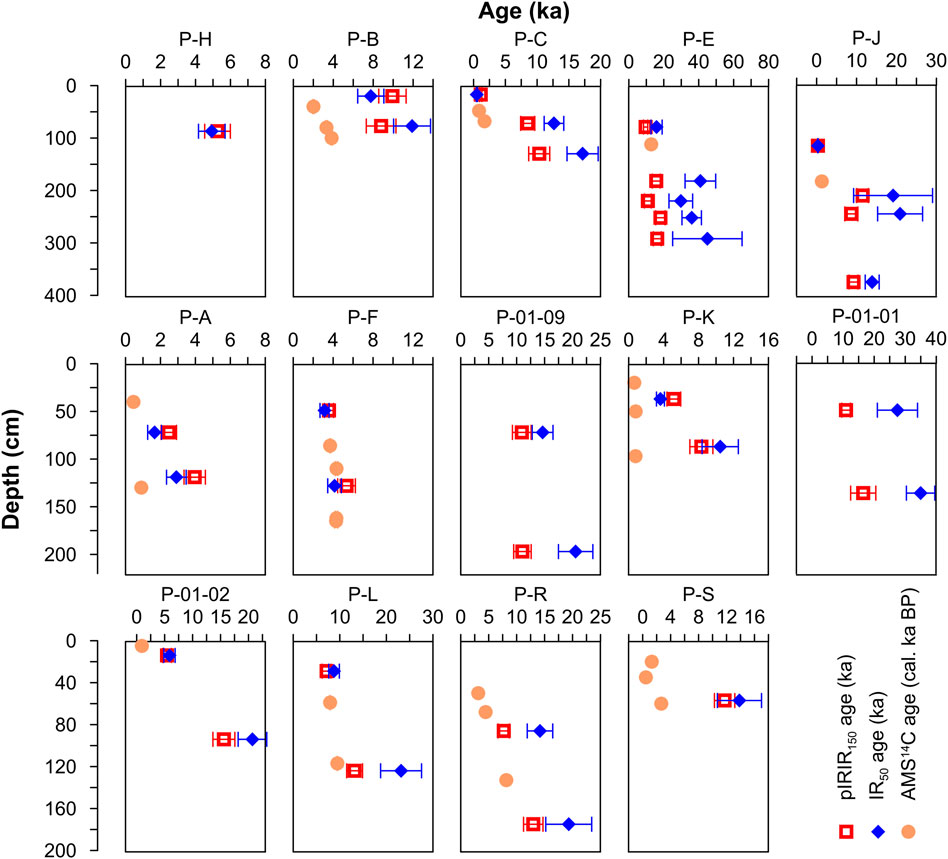
FIGURE 9. Comparison between the luminescence ages and the radiocarbon dates for each profile. The fading corrected pIRIR150 and IR50 ages were determined using the sDRC fitted by a single saturating exponential function and fading corrected following Lamothe et al. (2003).
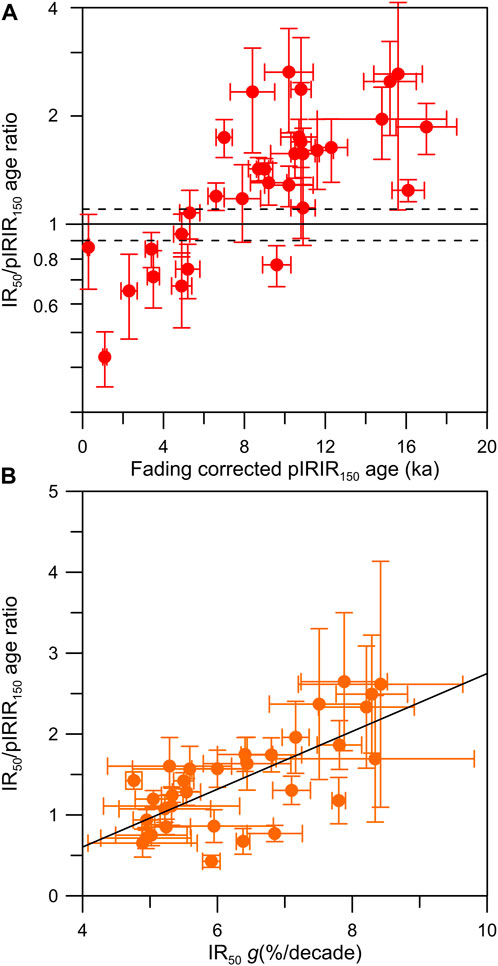
FIGURE 10. Comparison between the IR50 and pIRIR150 ages. (A) The relationship between the IR50/pIRIR150 age ratio and the fading corrected pIRIR150 ages. The IR50 and pIRIR150 ages used for calculating the age ratios are fading corrected following Lamothe et al. (2003). (B) Relationship between the IR50/pIRIR150 age ratio and g values for the IR50 signal with the trendline (black solid line).
The chronology of the soil and aeolian in the north slope of Khangai Mountain was subsequently established based on the degree of luminescence signal bleaching and comparison between the luminescence age and radiocarbon dates. The luminescence age of ca. 5 ka (sample LUM3775) is determined for the soil in profile P-H, broadly consistent with the fading corrected IR50 ages, indicating the pIRIR150 signal was well bleached. The IR50 fading rate is 4.95%/decade, suggesting that the IR50 age is not problematic concerning fading over-correction (Figure 9). The pIRIR150 and IR50 ages largely overestimate the radiocarbon dates younger than ca. 4 ka in profile P-B. The IR50 ages are likely over-corrected by the fading rates of 6–7%/decade. The pIRIR150 signal was probably poorly bleached, shown by slight anti-stratigraphic order and overestimation of the corresponding IR50 ages. The radiocarbon dates of P-B might be underestimated because they are still younger than the fading uncorrected IR50 ages, especially for the lowermost two ages (Figure 9). Similarly, the underestimated radiocarbon dates and the overestimated luminescence ages are observed in profile P-K. The radiocarbon dates in profiles P-S and P-A are also likely underestimated, but the pIRIR150 and IR50 ages are broadly in agreement (Figure 9), for which the fading corrected IR50 ages are reliable if taking 6%/decade as the lower boundary of fading over-correction. In profile P-F, the pIRIR150 and IR50 ages are consistent within the uncertainty, agreeing with the radiocarbon dates in stratigraphic order. The consistency of the pIRIR150 ages and radiocarbon dates in stratigraphic order are observed for profiles P-E, P-J, P-01-02, and P-R, whereas the corresponding IR50 ages are overestimated due to fading over-correction. The IR50 ages are also over-corrected in profiles P-C, P-01-09, P-01-01, and P-L. The luminescence chronology based on the pIRIR150 ages reveals that the investigated sediment profiles record the sedimentation and environmental information on the north slope of Khangai Mountain after the Last Glacial Maximum (LGM).
8 Conclusion
In this study, 32 K-feldspar samples from the north slope of Khangai Mountain, Mongolia, were dated using the pIRIR150 protocol. The applicability of the standardized dose-response curve (sDRC) and the fading correction models were evaluated. The degree of bleaching for the applied luminescence signals was assessed by comparing the associated ages with the radiocarbon dates. The timing of sedimentation in explored profiles from the north slope of Khangai Mountain was finally determined. The main conclusions are drawn as follows:
▪ The sDRCs, constructed for both the K-feldspar pIRIR150 and IR50 signals according to the re-normalization and test dose-standardization procedures, could yield a consistent De value compared to the individual DRC within ca. 40 Gy, suggesting that the sDRC is applicable for more effective De measurement of the Mongolian sediments.
▪ The fading corrected ages following Huntley and Lamothe (2001) and Lamothe et al. (2003) are broadly in agreement for the IR50 and pIRIR150 signals. With the increase in age and/or fading rate, the fading corrected age using the model solely for the linear region of dose growth may underestimate that corrected by the model appliable for the full dose region.
▪ Some of the fading corrected IR50 ages are overestimated, most likely resulting from fading over-correction, whereas the overestimation of several pIRIR150 ages is derived from partial bleaching.
Data availability statement
The original contributions presented in the study are included in the article/Supplementary Material. Further inquiries can be directed to the corresponding author.
Author contributions
Conceptualization and methodology, YL and MF; formal analysis, YL, ST, MK, DS and MF; original draft preparation, YL and ST; and review and editing, YL, ST, MK, DS and MF. All authors have read and agreed to the published version of the manuscript.
Funding
YL is financially supported by the National Natural Science Foundation (no. 41907376), the Excellent Chinese and Foreign Young Scientist Exchange Program of CAST, and the 111 Project (no. B20011). The field work was supported by the Deutsche Forschungsgemeinschaft (DFG. no. 385460422).
Acknowledgments
Sabine Mogwitz in S3 LIAG is thanked for sample preparation in the laboratory.
Conflict of interest
The authors declare that the research was conducted in the absence of any commercial or financial relationships that could be construed as a potential conflict of interest.
Publisher’s note
All claims expressed in this article are solely those of the authors and do not necessarily represent those of their affiliated organizations or those of the publisher, the editors, and the reviewers. Any product that may be evaluated in this article, or claim that may be made by its manufacturer, is not guaranteed or endorsed by the publisher.
Supplementary material
The Supplementary Material for this article can be found online at: https://www.frontiersin.org/articles/10.3389/feart.2022.939852/full#supplementary-material
References
Balescu, S., Ritz, J. F., Lamothe, M., Auclair, M., and Todbileg, M. (2007). Luminescence dating of a gigantic palaeolandslide in the Gobi-Altay mountains, Mongolia. Quat. Geochronol. 2, 290–295. doi:10.1016/j.quageo.2006.05.026
Böhner, J. (2006). General climatic controls and topoclimatic variations in Central and High Asia. Boreas 35, 279–295. doi:10.1111/j.1502-3885.2006.tb01158.x
Buylaert, J. P., Murray, A. S., Gebhardt, A. C., Sohbati, R., Ohlendorf, C., Thiel, C., et al. (2013). Luminescence dating of the PASADO core 5022-1D from Laguna Potrok Aike (Argentina) using IRSL signals from feldspar. Quat. Sci. Rev. 71, 70–80. doi:10.1016/j.quascirev.2013.03.018
Buylaert, J. P., Murray, A. S., Thomsen, K. J., and Jain, M. (2009). Testing the potential of an elevated temperature IRSL signal from K-feldspar. Radiat. Meas. 44, 560–565. doi:10.1016/j.radmeas.2009.02.007
Colarossi, D., Duller, G. A. T., Roberts, H. M., Tooth, S., and Lyons, R. (2015). Comparison of paired quartz OSL and feldspar post-IR IRSL dose distributions in poorly bleached fluvial sediments from South Africa. Quat. Geochronol. 30, 233–238. doi:10.1016/j.quageo.2015.02.015
Feng, Z. D., Wang, W. G., Guo, L. L., Khosbayar, P., Narantsetseg, T., Jull, A. J. T., et al. (2005). Lacustrine and eolian records of holocene climate changes in the Mongolian plateau: Preliminary results. Quat. Int. 136, 25–32. doi:10.1016/j.quaint.2004.11.005
Feng, Z. D., Zhai, X. W., Ma, Y. Z., Huang, C. Q., Wang, W. G., Zhang, H. C., et al. (2007). Eolian environmental changes in the Northern Mongolian Plateau during the past ∼35, 000 yr. Palaeogeogr. Palaeoclimatol. Palaeoecol. 245, 505–517. doi:10.1016/j.palaeo.2006.09.009
Fowell, S. J., Hansen, B. C. S., Peck, J. A., Khosbayar, P., and Ganbold, E. (2017). Mid to late Holocene climate evolution of the Lake Telmen Basin, North Central Mongolia, based on palynological data. Quat. Res. 59, 353–363. doi:10.1016/s0033-5894(02)00020-0
Fu, X., Li, B., Jacobs, Z., Jankowski, N. R., Cohen, T. J., and Roberts, R. G. (2020). Establishing standardised growth curves (SGCs) for OSL signals from individual grains of quartz: A continental-scale case study. Quat. Geochronol. 60, 101107. doi:10.1016/j.quageo.2020.101107
Fu, X., and Li, S.-H. (2013). A modified multi-elevated-temperature post-IR IRSL protocol for dating Holocene sediments using K-feldspar. Quat. Geochronol. 17, 44–54. doi:10.1016/j.quageo.2013.02.004
Fuchs, M., and Owen, L. A. (2008). Luminescence dating of glacial and associated sediments: Review, recommendations and future directions. Boreas 37, 636–659. doi:10.1111/j.1502-3885.2008.00052.x
Guo, Y., Li, B., Zhang, J., Yuan, B., Xie, F., and Roberts, R. (2016). Luminescence ages for three ‘Middle Palaeolithic’ sites in the Nihewan Basin, northern China, and their archaeological and palaeoenvironmental implications. Quat. Res. 85, 456–470. doi:10.1016/j.yqres.2016.03.002
Huntley, D. J., and Baril, M. R. (1997). The K content of the K-feldspars being measured in optical dating or in thermoluminescence dating. Anc. TL 15, 11–13.
Huntley, D. J., and Hancock, R. G. V. (2001). The Rb contents of the K-feldspars being measured in optical dating. Anc. TL 19, 43–46.
Huntley, D. J., and Lamothe, M. (2001). Ubiquity of anomalous fading in K-feldspars and the measurement and correction for it in optical dating. Can. J. Earth Sci. 38, 1093–1106. doi:10.1139/e01-013
Kars, R. H., Wallinga, J., and Cohen, K. M. (2008). A new approach towards anomalous fading correction for feldspar IRSL dating — Tests on samples in field saturation. Radiat. Meas. 43, 786–790. doi:10.1016/j.radmeas.2008.01.021
Klinge, M., Schneider, F., Li, Y., Frechen, M., and Sauer, D. (2022). Variations in geomorphological dynamics in the northern Khangai Mountains, Mongolia, since the Late Glacial period. Geomorphology 401, 108113. doi:10.1016/j.geomorph.2022.108113
Klinge, M., Lehmkuhl, F., Schulte, P., Hülle, D., and Nottebaum, V. (2017). Implications of (reworked) aeolian sediments and paleosols for Holocene environmental change in Western Mongolia. Geomorphology 292, 59–71. doi:10.1016/j.geomorph.2017.04.027
Klinge, M., and Sauer, D. (2019). Spatial pattern of Late Glacial and Holocene climatic and environmental development in Western Mongolia - a critical review and synthesis. Quat. Sci. Rev. 210, 26–50. doi:10.1016/j.quascirev.2019.02.020
Lai, Z. (2006). Testing the use of an OSL standardised growth curve (SGC) for determination on quartz from the Chinese Loess Plateau. Radiat. Meas. 41, 9–16. doi:10.1016/j.radmeas.2005.06.031
Lamothe, M., Auclair, M., Hamzaoui, C., and Huot, S. (2003). Towards a prediction of long-term anomalous fading of feldspar IRSL. Radiat. Meas. 37, 493–498. doi:10.1016/s1350-4487(03)00016-7
Lamothe, M., Forget Brisson, L., and Hardy, F. (2020). Circumvention of anomalous fading in feldspar luminescence dating using Post-Isothermal IRSL. Quat. Geochronol. 57, 101062. doi:10.1016/j.quageo.2020.101062
Lamothe, M. (2016). Luminescence dating of interglacial coastal depositional systems: Recent developments and future avenues of research. Quat. Sci. Rev. 146, 1–27. doi:10.1016/j.quascirev.2016.05.005
Lehmkuhl, F., Hilgers, A., Fries, S., Hülle, D., Schlütz, F., Shumilovskikh, L., et al. (2011). Holocene geomorphological processes and soil development as indicator for environmental change around Karakorum, Upper Orkhon Valley (Central Mongolia). Catena 87, 31–44. doi:10.1016/j.catena.2011.05.005
Lehmkuhl, F., Klinge, M., Rother, H., and Hülle, D. (2016). Distribution and timing of Holocene and late Pleistocene glacier fluctuations in Western Mongolia. Ann. Glaciol. 57, 169–178. doi:10.3189/2016aog71a030
Lehmkuhl, F., Nottebaum, V., and Hülle, D. (2018). Aspects of late quaternary geomorphological development in the Khangai mountains and the gobi altai mountains (Mongolia). Geomorphology 312, 24–39. doi:10.1016/j.geomorph.2018.03.029
Li, B., Jacobs, Z., Roberts, R. G., and Li, S.-H. (2018). Single-grain dating of potassium-rich feldspar grains: Towards a global standardised growth curve for the post-IR IRSL signal. Quat. Geochronol. 45, 23–36. doi:10.1016/j.quageo.2018.02.001
Li, B., and Li, S.-H. (2011). Luminescence dating of K-feldspar from sediments: A protocol without anomalous fading correction. Quat. Geochronol. 6, 468–479. doi:10.1016/j.quageo.2011.05.001
Li, B., Roberts, R. G., Jacobs, Z., Li, S.-H., and Guo, Y.-J. (2015b). Construction of a ‘global standardised growth curve’ (gSGC) for infrared stimulated luminescence dating of K-feldspar. Quat. Geochronol. 27, 119–130. doi:10.1016/j.quageo.2015.02.010
Li, B., Roberts, R. G., Jacobs, Z., and Li, S.-H. (2015a). Potential of establishing a ‘global standardised growth curve’ (gSGC) for optical dating of quartz from sediments. Quat. Geochronol. 27, 94–104. doi:10.1016/j.quageo.2015.02.011
Li, Y., Shang, Z. W., Tsukamoto, S., Tamura, T., Yi, L., Wang, H., et al. (2018b). Quartz and K-feldspar luminescence dating of sedimentation in the North Bohai coastal area (NE China) since the late pleistocene. J. Asian Earth Sci. 152, 103–115. doi:10.1016/j.jseaes.2017.10.036
Li, Y., Tsukamoto, S., Hu, K., and Frechen, M. (2017). Quartz OSL and K-feldspar post-IR IRSL dating of sand accumulation in the lower liao plain (liaoning, NE China). Geochronometria 44, 1–15. doi:10.1515/geochr-2015-0051
Li, Y., Tsukamoto, S., Long, H., Zhang, J., Yang, L., He, Z., et al. (2018a). Testing the reliability of fading correction methods for feldspar IRSL dating: A comparison between natural and simulated-natural dose response curves. Radiat. Meas. 120, 228–233. doi:10.1016/j.radmeas.2018.06.025
Long, H., Haberzettl, T., Tsukamoto, S., Shen, J., Kasper, T., Daut, G., et al. (2015). Luminescence dating of lacustrine sediments from Tangra Yumco (southern Tibetan Plateau) using post-IR IRSL signals from polymineral grains. Boreas 44, 139–152. doi:10.1111/bor.12096
Long, H., Lai, Z., Fan, Q., Sun, Y., and Liu, X. (2010). Applicability of a quartz OSL standardised growth curve for De determination up to 400Gy for lacustrine sediments from the Qaidam Basin of the Qinghai-Tibetan Plateau. Quat. Geochronol. 5, 212–217. doi:10.1016/j.quageo.2009.05.005
Long, H., Shen, J., Tsukamoto, S., Chen, J., Yang, L., and Frechen, M. (2014). Dry early Holocene revealed by sand dune accumulation chronology in Bayanbulak Basin (Xinjiang, NW China). Holocene 24, 614–626. doi:10.1177/0959683614523804
Madsen, A., Buylaert, J.-P., and Murray, A. (2011). Luminescence dating of young coastal deposits from New Zealand using feldspar. Geochronometria 38, 379–390. doi:10.2478/s13386-011-0042-5
Mejdahl, V. (1979). Thermoluminescence dating: Beta-dose attenuation in quartz grains. Archaeometry 21, 61–72. doi:10.1111/j.1475-4754.1979.tb00241.x
Mercier, N., Martin, L., Kreutzer, S., Moineau, V., and Cliquet, D. (2019). Dating the palaeolithic footprints of ‘le rozel’ (normandy, France). Quat. Geochronol. 49, 271–277. doi:10.1016/j.quageo.2017.12.005
Murray, A. S., Thomsen, K. J., Masuda, N., Buylaert, J. P., and Jain, M. (2012). Identifying well-bleached quartz using the different bleaching rates of quartz and feldspar luminescence signals. Radiat. Meas. 47, 688–695. doi:10.1016/j.radmeas.2012.05.006
Nalin, R., Lamothe, M., Auclair, M., and Massari, F. (2020). Chronology of the marine terraces of the Crotone Peninsula (Calabria, southern Italy) by means of infrared-stimulated luminescence (IRSL). Mar. Petroleum Geol. 122, 104645. doi:10.1016/j.marpetgeo.2020.104645
Peck, J. A., Khosbayar, P., Fowell, S. J., Pearce, R. B., Ariunbileg, S., Hansen, B. C. S., et al. (2002). Mid to Late Holocene climate change in north centralMongolia as recorded in the sediments of Lake Telmen. Palaeogeogr. Palaeoclimatol. Palaeoecol. 183, 135–153. doi:10.1016/s0031-0182(01)00465-5
Peng, J., Dong, Z., Han, F., Long, H., and Liu, X. (2013). R package numOSL: Numeric routines for optically stimulated luminescence dating. Anc. TL 31, 41–48.
Prasad, A. K., Poolton, N. R. J., Kook, M., and Jain, M. (2017). Optical dating in a new light: A direct, non-destructive probe of trapped electrons. Sci. Rep. 7, 12097. doi:10.1038/s41598-017-10174-8
Prescott, J. R., and Hutton, J. T. (1994). Cosmic ray contributions to dose rates for luminescence and ESR dating Large depths and long-term time variations. Radiat. Meas. 23, 497–500. doi:10.1016/1350-4487(94)90086-8
Reimann, T., Notenboom, P. D., De Schipper, M. A., and Wallinga, J. (2015). Testing for sufficient signal resetting during sediment transport using a polymineral multiple-signal luminescence approach. Quat. Geochronol. 25, 26–36. doi:10.1016/j.quageo.2014.09.002
Reimann, T., and Tsukamoto, S. (2012). Dating the recent past (<500 years) by post-IR IRSL feldspar–examples from the North Sea and Baltic Sea coast. Quaternary Geochronology 10, 180–187.
Reimann, T., Tsukamoto, S., Naumann, M., and Frechen, M. (2011). The potential of using K-rich feldspars for optical dating of young coastal sediments – a test case from Darss-Zingst peninsula (southern Baltic Sea coast). Quat. Geochronol. 6, 207–222. doi:10.1016/j.quageo.2010.10.001
Roberts, H. M., and Duller, G. A. T. (2004). Standardised growth curves for optical dating of sediment using multiple-grain aliquots. Radiat. Meas. 38, 241–252. doi:10.1016/j.radmeas.2003.10.001
Roberts, H. M. (2008). The development and application of luminescence dating to loess deposits: A perspective on the past, present and future. Boreas 37, 483–507. doi:10.1111/j.1502-3885.2008.00057.x
Schwanghart, W., Frechen, M., Kuhn, N. J., and Schütt, B. (2009). Holocene environmental changes in the Ugii Nuur basin, Mongolia. Palaeogeogr. Palaeoclimatol. Palaeoecol. 279, 160–171. doi:10.1016/j.palaeo.2009.05.007
Telfer, M. W., Bateman, M. D., Carr, A. S., and Chase, B. M. (2008). Testing the applicability of a standardized growth curve (SGC) for quartz OSL dating: Kalahari dunes, South African coastal dunes and Florida dune cordons. Quat. Geochronol. 3, 137–142. doi:10.1016/j.quageo.2007.08.001
Thiel, C., Buylaert, J.-P., Murray, A., Terhorst, B., Hofer, I., Tsukamoto, S., et al. (2011). Luminescence dating of the Stratzing loess profile (Austria) – testing the potential of an elevated temperature post-IR IRSL protocol. Quat. Int. 234, 23–31. doi:10.1016/j.quaint.2010.05.018
Thomsen, K. J., Jain, M., Murray, A. S., Denby, P. M., Roy, N., and Bøtter-Jensen, L. (2008). Minimizing feldspar OSL contamination in quartz UV-OSL using pulsed blue stimulation. Radiat. Meas. 43, 752–757. doi:10.1016/j.radmeas.2008.01.020
Thrasher, I. M., Mauz, B., Chiverrell, R. C., and Lang, A. (2009). Luminescence dating of glaciofluvial deposits: A review. Earth. Sci. Rev. 97, 133–146. doi:10.1016/j.earscirev.2009.09.001
Tsukamoto, S., and Duller, G. A. T. (2008). Anomalous fading of various luminescence signals from terrestrial basaltic samples as Martian analogues. Radiat. Meas. 43, 721–725. doi:10.1016/j.radmeas.2007.10.025
Tsukamoto, S., Kataoka, K., Oguchi, T., Murray, A. S., and Komatsu, G. (2014). Luminescence dating of scoria fall and lahar deposits from Somma–Vesuvius, Italy. Quat. Geochronol. 20, 39–50. doi:10.1016/j.quageo.2013.10.005
Tsukamoto, S., Kondo, R., Lauer, T., and Jain, M. (2017). Pulsed IRSL: A stable and fast bleaching luminescence signal from feldspar for dating quaternary sediments. Quat. Geochronol. 41, 26–36. doi:10.1016/j.quageo.2017.05.004
Wallinga, J., Bos, A. J. J., Dorenbos, P., Murray, A. S., and Schokker, J. (2007). A test case for anomalous fading correction in IRSL dating. Quat. Geochronol. 2, 216–221. doi:10.1016/j.quageo.2006.05.014
Wallinga, J., Murray, A., and Wintle, A. G. (2000). The single-aliquot regenerative-dose (SAR) protocol applied to coarse-grain feldspar. Radiat. Meas. 32, 529–533. doi:10.1016/s1350-4487(00)00091-3
Wallinga, J. (2002). Optically stimulated luminescence dating of fluvial deposits: A review. Boreas 31, 303–322. doi:10.1111/j.1502-3885.2002.tb01076.x
Wintle, A. G., and Murray, A. (2000). Quartz OSL: Effects of thermal treatment and their relevance to laboratory dating procedures. Radiat. Meas. 32, 387–400. doi:10.1016/s1350-4487(00)00057-3
Yi, S., Buylaert, J. P., Murray, A. S., Thiel, C., Zeng, L., and Lu, H. (2015). High resolution OSL and post-IR IRSL dating of the last interglacial-glacial cycle at the Sanbahuo loess site (northeastern China). Quat. Geochronol. 30, 200–206. doi:10.1016/j.quageo.2015.02.013
Keywords: K-feldspar luminescence dating, standardized dose-response curve (sDRC), fading correction, Mongolia, Late Pleistocene
Citation: Li Y, Tsukamoto S, Klinge M, Sauer D and Frechen M (2023) K-feldspar pIRIR150 dating of the Late Pleistocene sediments in the NW Khangai Mountains (Mongolia) using a standardized dose-response curve approach. Front. Earth Sci. 10:939852. doi: 10.3389/feart.2022.939852
Received: 09 May 2022; Accepted: 30 August 2022;
Published: 10 January 2023.
Edited by:
Yuxin Fan, Lanzhou University, ChinaCopyright © 2023 Li, Tsukamoto, Klinge, Sauer and Frechen. This is an open-access article distributed under the terms of the Creative Commons Attribution License (CC BY). The use, distribution or reproduction in other forums is permitted, provided the original author(s) and the copyright owner(s) are credited and that the original publication in this journal is cited, in accordance with accepted academic practice. No use, distribution or reproduction is permitted which does not comply with these terms.
*Correspondence: Yan Li, yan.li@cugb.edu.cn, geo-liyan@foxmail.com